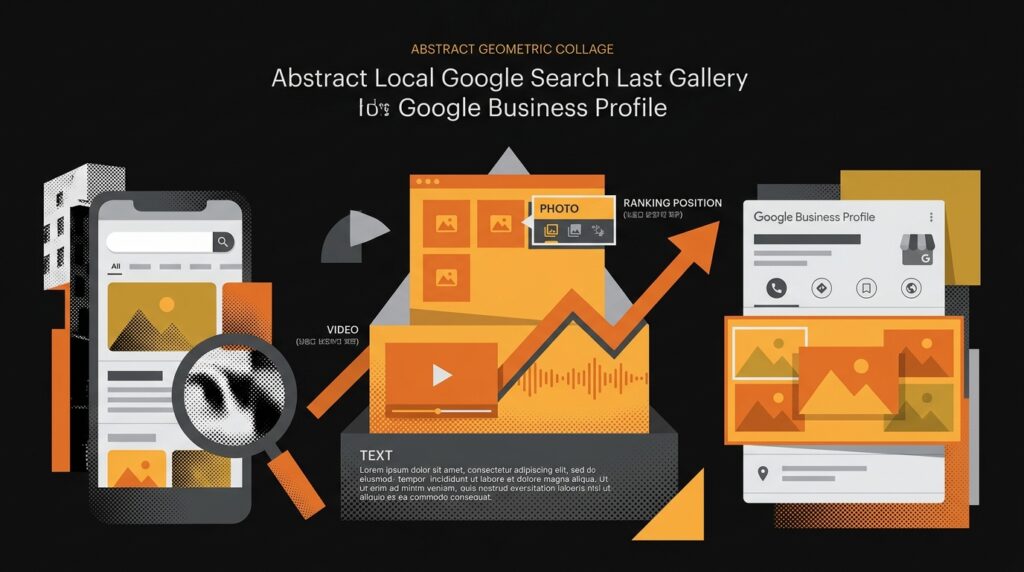
Google Business Profile listings with photos receive 42% more requests for directions and 35% more clicks through to websites than those without, according to Google’s own data cited by Rio SEO. Visual content on your GBP profile directly influences local ranking signals through engagement metrics, freshness cues, and AI-interpreted relevance data, making photos and videos core ranking inputs for any local SEO visual content strategy.
TL;DR: Google treats photos and videos on your Business Profile as active ranking signals. Listings with photos get 42% more direction requests and 35% more website clicks. For Australian local businesses, visual content freshness, quality, and user engagement feed directly into the prominence calculation that determines Local Pack placement.
Google’s Three Local Ranking Pillars and Where Visuals Fit
Google’s local algorithm evaluates businesses on three primary signals: relevance, distance, and prominence. The 2026 BrightLocal Local Search Ranking Factors survey confirms that primary category remains the single most influential factor for Local Pack rankings, with additional categories ranked 8th. But prominence, the signal capturing how well-known and trusted a business appears, is where visual content plays its strongest role.
Prominence absorbs engagement metrics. When someone views your GBP listing, scrolls through photos, watches a video, then requests directions or calls, Google records each interaction. WhiteSpark’s research, cited by Uberall, describes the mechanism plainly: “real humans engaging with your GBP — by dwelling on it, looking through your photos, reading reviews, watching videos” directly improves rankings. Google interprets that engagement as a trust signal.
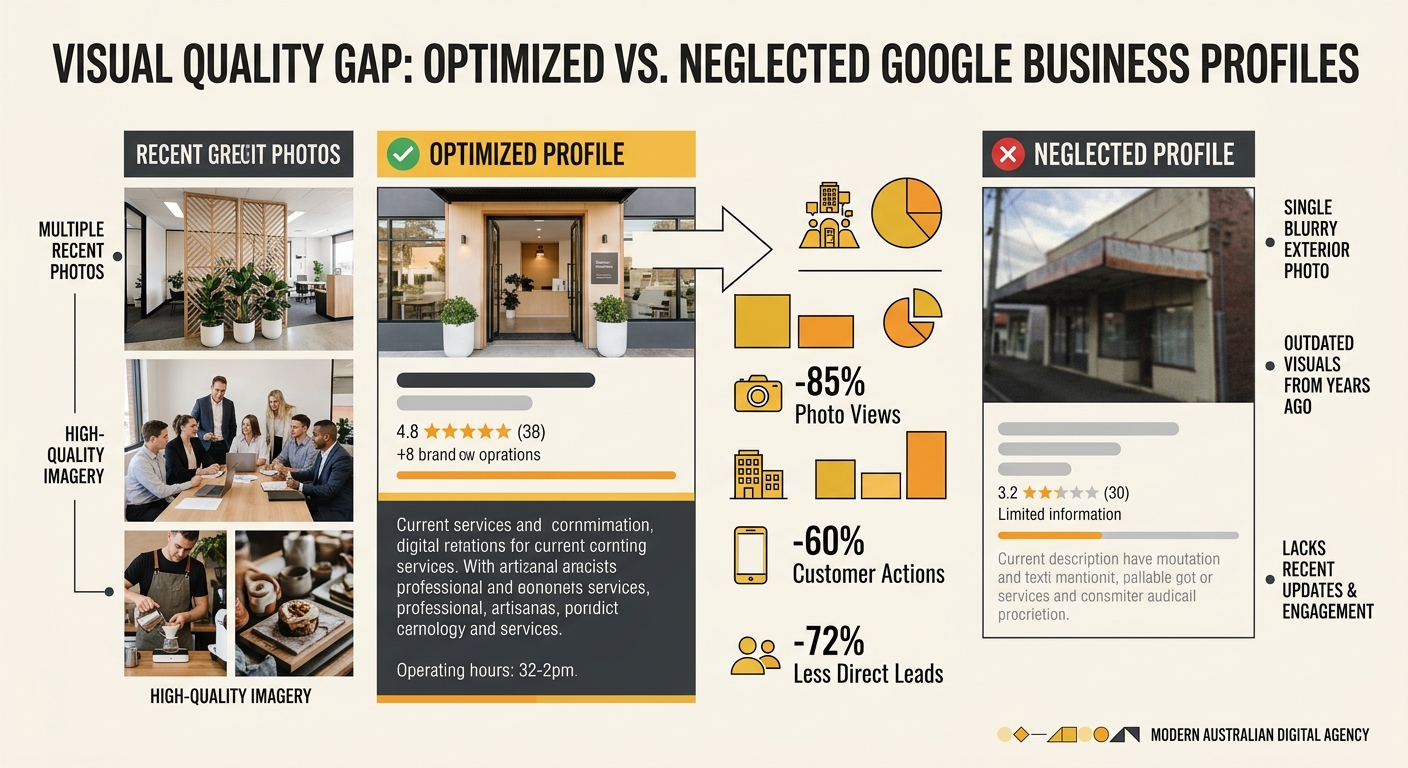
This is where the content gap shows up for most Australian local businesses. They’ve picked their primary category, filled in the business description, maybe collected a handful of reviews. The visual layer of their profile sits untouched: a logo uploaded years ago, three blurry shopfront photos, zero videos. And that neglect shows up in the data as a measurable prominence deficit compared to competitors who keep their visual profiles active.
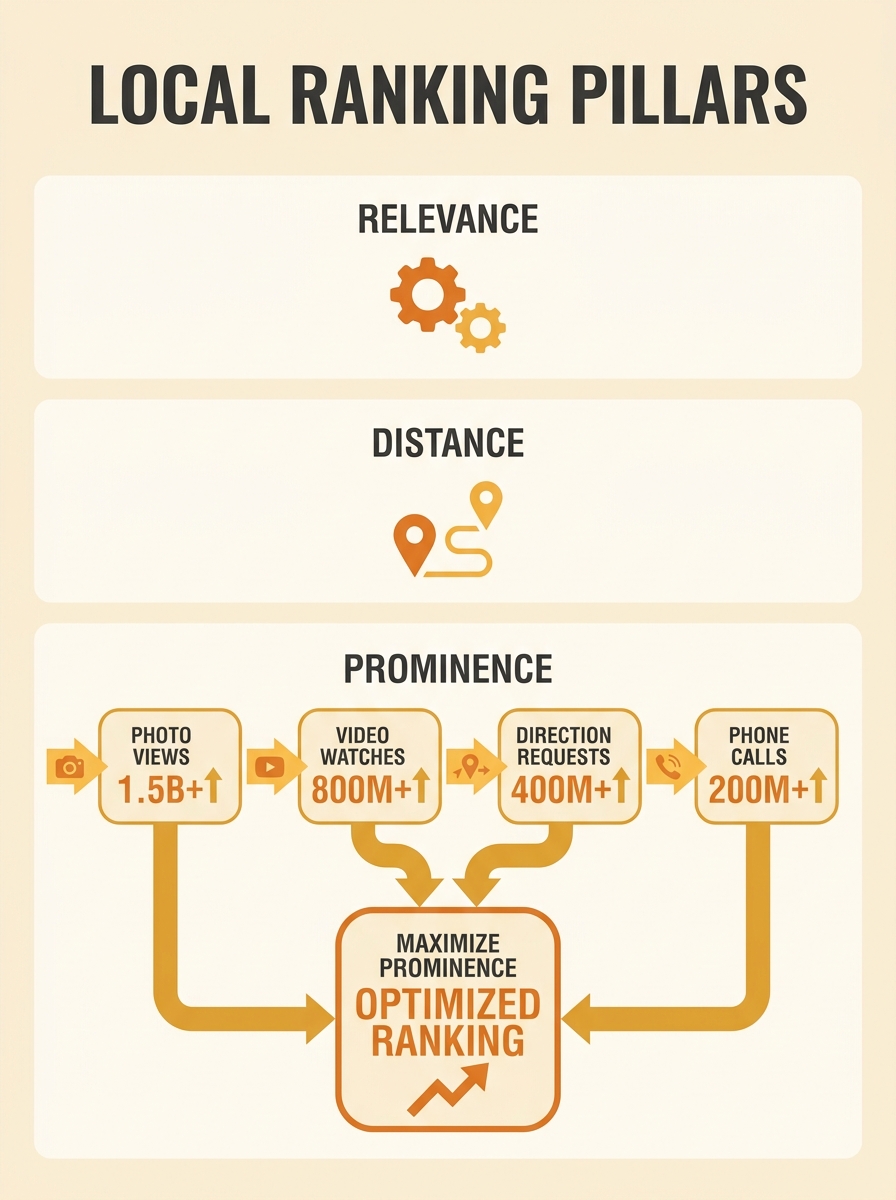
Photo Quality and Freshness as Measurable Signals
Google uses photo quality and update frequency as ranking signals influencing local search visibility, according to Review Overhaul’s analysis of GBP ranking factors. The 35% website click increase tied to photo-equipped listings is an average across all industries. Businesses that upload regularly and maintain high-quality images outperform those with static, outdated galleries.
Keely McGroarty, SEO Strategist at Ignite Visibility, advises uploading new visuals at least monthly to maintain freshness, a factor Google actively tracks. That cadence matters more than volume. A profile with 200 photos all uploaded on the same day in 2023 reads differently to Google’s systems than a profile with 50 photos spread across 18 months of consistent updates. The freshness signal rewards regular activity, not bulk dumps.
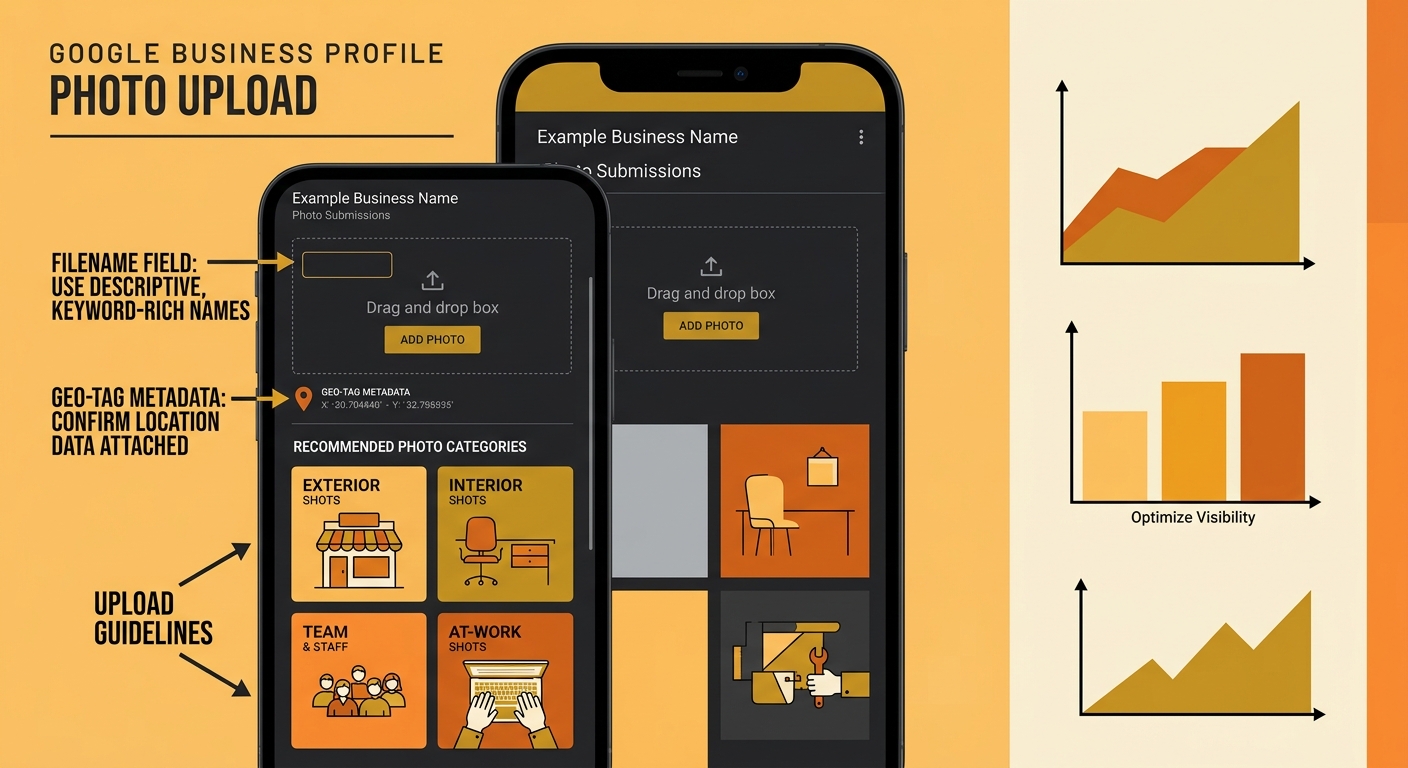
There’s also a geo-tagging dimension that most businesses overlook entirely. Embedding GPS coordinates into image EXIF metadata helps Google associate visual content with specific service areas. For a plumber serving both Sydney’s Inner West and the Northern Beaches, photos tagged with location-specific coordinates strengthen the relevance signal for each area independently.
Customer-uploaded photos contribute to profile activity too. Reddit’s local SEO community has documented that user-submitted photos count toward engagement signals, with some practitioners reporting customer-tagged photos generated roughly 30% of total profile photo impressions. Encouraging customers to snap and upload their own images after a visit is free engagement generation for your profile.
If you’ve been treating images purely as a design concern, our guide to why under-optimised visuals affect your technical SEO covers the performance side of this equation, where file size, format, and compression order all matter for the pages hosting these images.
How Video Changes the Local Engagement Equation
Short-form video on Google Business Profiles increases dwell time on listings, and dwell time is now weighted in local ranking algorithms. Bright Valley Media’s local SEO video research found that videos under 30 seconds showcasing team activity, completed work, or customer interactions generate the strongest engagement signals for local businesses.
Why does video carry disproportionate weight? Because so few local businesses use it. WebFX data shows AI Overviews now appear in 25.8% of US searches, and video content is increasingly pulled into these AI-generated results. Google’s systems prefer content demonstrating real-world experience. A 20-second walkthrough of a completed kitchen renovation provides evidence of expertise that a text description can’t replicate.
For Australian local businesses, the barrier to entry is lower than it appears. A smartphone video of your workshop, your team mid-project, or a finished job, uploaded directly to your GBP profile, feeds the same engagement signals as professionally produced content. The algorithm measures whether people watch, pause, and interact. Production values are secondary.
A smartphone video of your workshop uploaded to GBP feeds the same engagement signals as professionally produced content. The algorithm measures whether people watch and interact, not whether you hired a videographer.
This connects to broader shifts in how Google evaluates local businesses. As we’ve covered in our analysis of how AI is reshaping search strategy for Australian businesses, the systems increasingly reward signals of authentic, first-hand experience over polished marketing collateral. Video is the single most direct way to demonstrate that experience at scale.
The Visual Signal Stack: A Prioritisation Framework
Across the data, three distinct layers of visual signal contribute to local prominence. I’m calling this the Visual Signal Stack, ordered by impact and effort required.
Layer 1: Owned photo freshness. Your business uploads high-quality, geo-tagged photos at a consistent monthly cadence. This is the baseline. Categories to cover include exterior (daylight and evening), interior, team members, products or services in progress, and completed work. Each photo file should carry descriptive filenames with local keywords (e.g., “roof-repair-wollongong-completed.jpg”) and appropriate alt text.
Layer 2: Video engagement. Short videos (under 30 seconds) uploaded to GBP and embedded on your website’s location pages. Prioritise walkthroughs, before-and-after sequences, and brief team introductions. These generate dwell time and cross-platform engagement signals that compound with your photo freshness data.
Layer 3: User-generated visual activity. Customer photos tagged to your location, review photos, and social media images referencing your business. This layer is harder to control but carries strong trust signals because it represents third-party validation. Asking satisfied customers to snap a photo with their purchase or completed project and upload it within their Google review builds this layer over time.
| Visual Signal Layer | Effort Level | Impact on Prominence | Update Frequency | Primary Metric |
|---|---|---|---|---|
| Owned photo freshness | Low | High (42% more direction requests) | Monthly minimum | Photo views, clicks |
| Video engagement | Medium | High (increased dwell time) | Quarterly minimum | Watch time, interactions |
| User-generated visuals | Low (requires prompting) | Medium-High (trust signal) | Ongoing | Customer photo count, tagged mentions |
If you’re running location pages built for local search, embedding these visual assets on-page rather than relying solely on GBP creates a second surface for Google to associate visual signals with your business entity. And if your profile has duplicate or inconsistent listings, visual content uploads to the wrong profile fragment your signals. We’ve detailed how duplicate listings destroy local rankings and why consolidation matters before you invest in visual content.
What This Means for Australian Local Search Visibility
Australian local search has distinct characteristics worth accounting for. The local SEO landscape documented by Maisona emphasises that visual content boosts engagement for the Australian market specifically, where the Google Maps three-pack dominates local intent queries across trades, hospitality, and professional services.
For Perth SEO campaigns specifically, local competition in trades and services categories is intense enough that visual signals now create measurable separation between ranked and unranked businesses. A Perth electrician with 40 geo-tagged project photos and 3 short videos uploaded across the preceding 12 months will outperform a competitor with identical reviews and citations but a bare-bones visual profile. The prominence gap compounds monthly.
Tip: When uploading photos to your GBP, use descriptive filenames with location and service keywords before uploading. Google reads filenames as metadata context. “plumber-blocked-drain-sydney-cbd.jpg” carries more signal than “IMG_4392.jpg”.
Core Web Vitals still matter for the pages hosting this content. INP (Interaction to Next Paint) replaced FID as a core metric in 2024, and uncompressed images or poorly embedded video can tank your page performance scores. The visual strategy has to work alongside your image compression approach for Core Web Vitals, not against it. Compress photos to WebP format, lazy-load below-fold images, and host video through YouTube or your GBP profile rather than self-hosting large files on your own location pages.
Small business video optimisation for local search doesn’t require a production budget. It requires consistency, geo-relevance, and content that demonstrates the actual work your business does for real customers. The algorithmic reward is already there in the engagement data. The question for most Australian businesses is whether they’ll close the visual content gap before their local competitors do.
What the Data Doesn’t Tell Us
The 42% direction request increase and 35% click-through boost are compelling, but they’re aggregate figures across all industries and regions. Google hasn’t published segmented data showing whether a Brisbane café benefits equally from photo uploads as a Melbourne accounting firm. The engagement dynamics differ significantly by vertical, and the numbers available don’t account for that.
Video’s impact on Local Pack ranking remains hard to isolate. Dwell time improvements are documented, but no controlled study has separated the ranking effect of GBP video from the correlated effects of businesses that upload video also tending to have more reviews, fresher profiles, and better overall presence. The visual activity may be a proxy for business owners who are simply more engaged with their online presence across every dimension.
What the data does confirm is the direction. Google’s local algorithm weights engagement signals, and visual content is the most direct way to generate those signals. For Australian local businesses in competitive markets, the gap between businesses investing in visual content and those ignoring it will widen as AI-driven search systems place greater emphasis on demonstrated, verifiable experience. The businesses maintaining a living, regularly updated visual profile are accumulating prominence signals that compound quarter over quarter. The ones still running a 2022 logo and three stock photos are falling behind in ways their analytics dashboards won’t surface until the ranking losses become obvious.