
A site architecture audit maps how Googlebot traverses your website’s hierarchy, link graph, and URL patterns, exposing structural problems that individual page-level fixes never reach. Technical SEO debt Australian businesses accumulate from platform migrations, ad hoc URL additions, and plugin bloat compounds silently, eroding 30 to 40% of potential organic visibility according to 2026 structural analysis data.
TL;DR: Fixing individual page errors (broken links, missing tags, slow loads) doesn’t address the structural layer where most SME traffic loss originates. A site architecture audit reveals how crawl budget gets wasted, which pages Googlebot can’t discover, and where URL decay has fragmented your site’s authority over months or years.
How Technical SEO Debt Accumulates Without Anyone Noticing
Technical SEO debt begins with structural inconsistencies that seem trivial in isolation: a developer adds /services/ and /our-services/ during a redesign, a WordPress plugin generates 300 parameter-based URLs overnight, or a CMS migration leaves 4 layers of 301 redirects chaining together. Each decision is small. Together, they create crawl inefficiencies, broken links, and slow page rendering that compound over time.
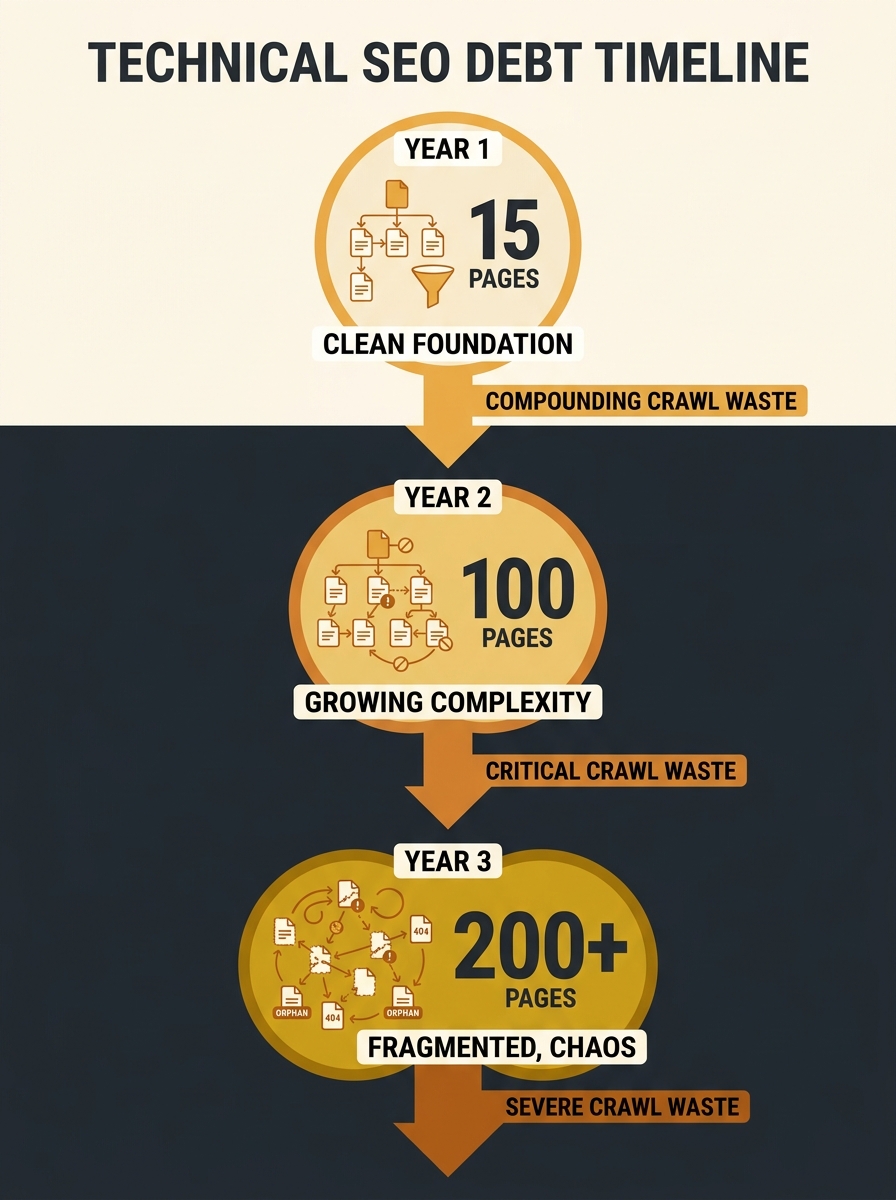
The pattern is predictable. An Australian tradie business launches with 15 pages. Over 3 years, it grows to 200 pages through blog posts, landing pages, service area pages, and seasonal promotions. Nobody audits the internal link structure as pages multiply. Nobody removes outdated campaign pages. Nobody consolidates the 6 different URL formats the site now uses for location pages.
By year 3, Googlebot spends 60% or more of its crawl budget on pages generating zero traffic, zero leads, and zero revenue. The important pages (your service pages, your money pages) get crawled less frequently. New content takes weeks to appear in search results instead of days.
Martin Splitt of Google’s Search Relations team has argued that effective audits require “experience and expertise” to identify underlying structural problems, warning against relying on tool-generated audit scores that highlight surface symptoms like 404 errors and missing alt text without exposing the architectural patterns that caused them.
The Three Layers a Site Architecture Audit Examines
A crawl efficiency assessment operates on three distinct layers that surface-level SEO tools don’t separate. Understanding these layers explains why running Screaming Frog and fixing red errors misses the structural picture.
Layer 1: The Crawl Graph
This layer maps every URL Googlebot can discover and the pathways between them. Google’s own crawl budget documentation outlines how to monitor crawl requests, response times, and download sizes through Search Console’s Crawl Stats report. For a 200-page SME website, a typical crawl graph audit reveals 40 to 60% of pages sitting 3 or more clicks from the homepage, a depth that reduces crawl frequency by approximately 70% compared to pages within 2 clicks.
If you’ve dealt with crawl efficiency problems across subdomains, the same principles apply at the page-depth level within a single domain.
Layer 2: The URL Taxonomy
URL structure optimisation examines whether your URLs communicate topical hierarchy to search engines. As Acclaim’s structural auditing framework spells out, URLs should be clean, descriptive, and keyword-optimised. In practice, Australian SME sites average 3 to 5 different URL formats for functionally similar content. One plumbing site might have /services/blocked-drains/, /blocked-drain-services-melbourne/, and /service/blocked-drains-plumber/ all existing simultaneously.
Each variant splits link equity. If you’ve already discovered that canonical tag issues cause duplicate content problems, URL taxonomy decay is often the root cause that generated those duplicates in the first place.
Layer 3: The Authority Distribution
Internal links pass PageRank between pages. An architecture audit maps where that authority actually flows versus where you need it to flow. On a typical 200-page SME site, 30 to 50% of internal links point to navigational or utility pages (privacy policy, terms, about us) rather than revenue-generating service pages. Blog posts frequently link to each other but rarely link to the service pages they should support.
On a typical 200-page SME site, 30 to 50% of internal links point to navigational or utility pages rather than revenue-generating service pages.
Search Engine Land’s architecture guide reinforces this point: “Don’t just link randomly, link with purpose. Pillar pages should point to supporting content, and vice versa.”
Google’s 2MB Crawl Limit and Why It Matters for SME Sites
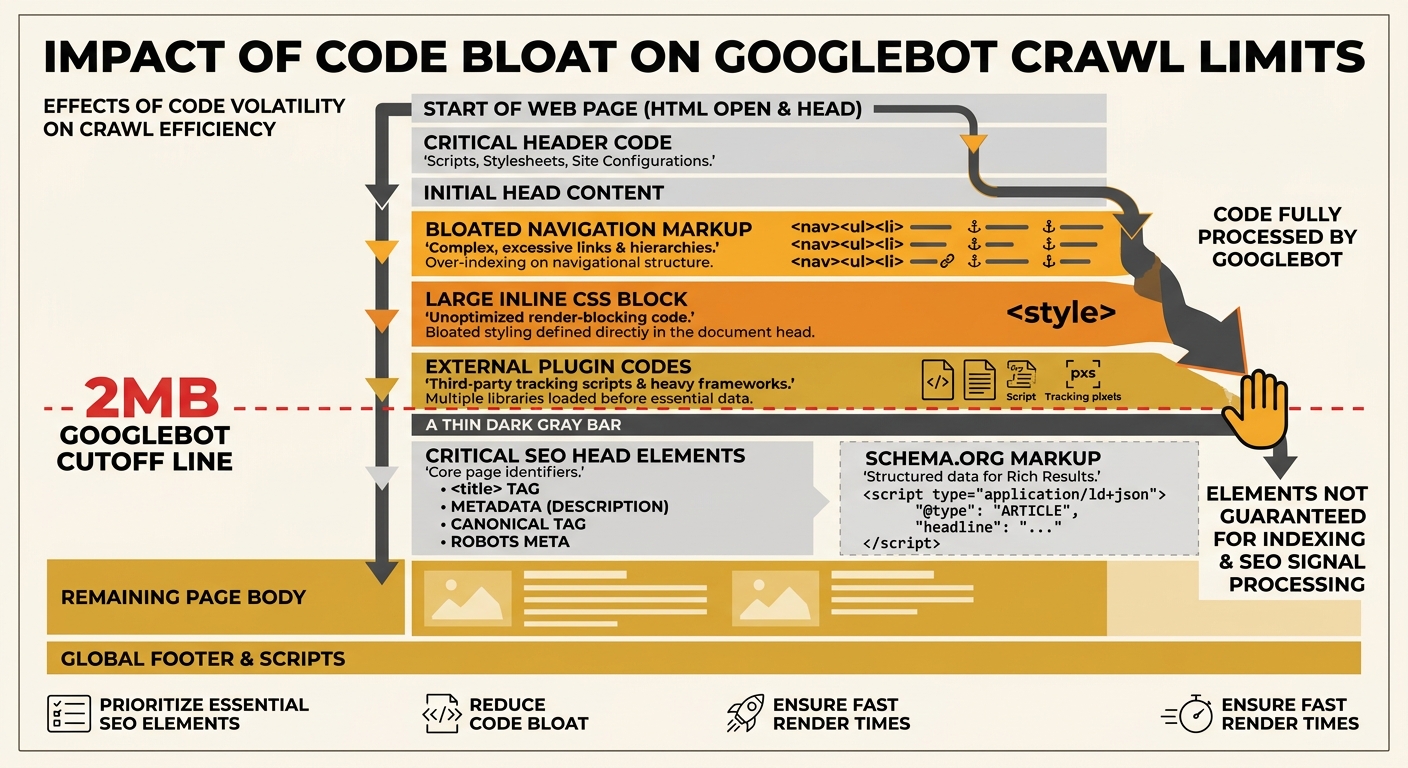
Gary Illyes confirmed in March 2026 that Googlebot enforces a 2MB crawl limit per URL. Any content beyond that threshold gets silently truncated. External resources (CSS files, JavaScript, images) don’t count toward this limit, but inline CSS, bloated navigation markup, and excessive widget code do.
For enterprise sites, 2MB sounds generous. For Australian SME sites running WordPress with 8 to 12 active plugins, a mega menu covering 50+ service pages, and inline styles injected by page builders, the real HTML output per page regularly hits 1.2 to 1.8MB. Add a schema markup block, a chat widget, and analytics scripts rendered inline, and critical SEO signals can land beyond the 2MB cutoff.
This means Googlebot literally doesn’t see the meta information you’ve carefully optimised. Your page title might be perfect, your schema might be technically valid, but if it sits past the 2MB mark in the raw HTML, it doesn’t exist as far as Google is concerned.
The fix involves moving inline styles to external stylesheets, reducing navigation markup, and auditing plugin-generated code. These are web development decisions that affect SEO outcomes directly, and they’re rarely flagged by standard audit tools.
Running a Crawl Efficiency Assessment on an SME Budget
You don’t need enterprise tools to perform a meaningful site architecture audit. Google Search Console’s Crawl Stats report provides crawl request volumes, server response times, and downloaded bytes for free. Pairing this data with server log analysis shows which URLs Googlebot actually visits versus which URLs you want it to prioritise.
A practical framework for SME-scale audits measures five dimensions:
| Audit Dimension | What It Measures | Free Tool | Warning Threshold |
|---|---|---|---|
| Crawl Depth | Clicks from homepage to each page | Screaming Frog (up to 500 URLs free) | Any page more than 3 clicks deep |
| URL Consistency | Number of distinct URL formats for similar content | Manual review + Search Console | More than 2 formats for the same content type |
| Link Distribution | Percentage of internal links pointing to revenue pages vs utility pages | Screaming Frog link report | Less than 40% flowing to revenue pages |
| Crawl Waste | Percentage of crawled URLs returning 3xx, 4xx, or 5xx | Search Console Crawl Stats | More than 15% non-200 responses |
| Page Size | Average HTML size per URL before external resources | Browser DevTools | Above 1.5MB raw HTML |
The SEO debugging workflow for Australian SMEs covers how to prioritise which issues to fix first when you’re working without an agency budget.
Tip: Check your Crawl Stats report in Google Search Console monthly. If your average response time exceeds 500ms or your crawl request count drops by more than 20% month-over-month, you likely have a server-side or structural problem reducing crawl efficiency.
Where the Audit Model Breaks
A site architecture audit assumes Googlebot behaves predictably. It often doesn’t. Crawl frequency varies by site reputation, server responsiveness, content freshness signals, and factors Google doesn’t publish. A page 4 clicks deep on a high-authority site might get crawled daily, while a page 1 click deep on a low-authority SME site might get crawled once a month.
The 30 to 40% traffic erosion figure from structural decay is a directional estimate, not a guaranteed measurement. Some sites carry significant architectural debt and rank well because their backlink profile or content quality compensates. Other sites with clean architecture underperform because the content doesn’t match search intent.
Architecture audits also struggle with JavaScript-rendered content. If your site uses client-side rendering for navigation elements or internal links, Googlebot’s rendering queue adds a delay of hours to days before those links are discovered. The audit tool sees the rendered page; Googlebot’s first pass may not.
And the audit itself creates a paradox for resource-constrained businesses. A thorough site architecture audit on a 200-page site takes 8 to 15 hours of skilled analysis. Fixing the issues it surfaces can take 40 to 80 hours of development work. For an Australian SME spending $2,000 to $5,000 per month on total marketing, that’s a significant allocation toward problems that don’t produce visible results for 3 to 6 months.
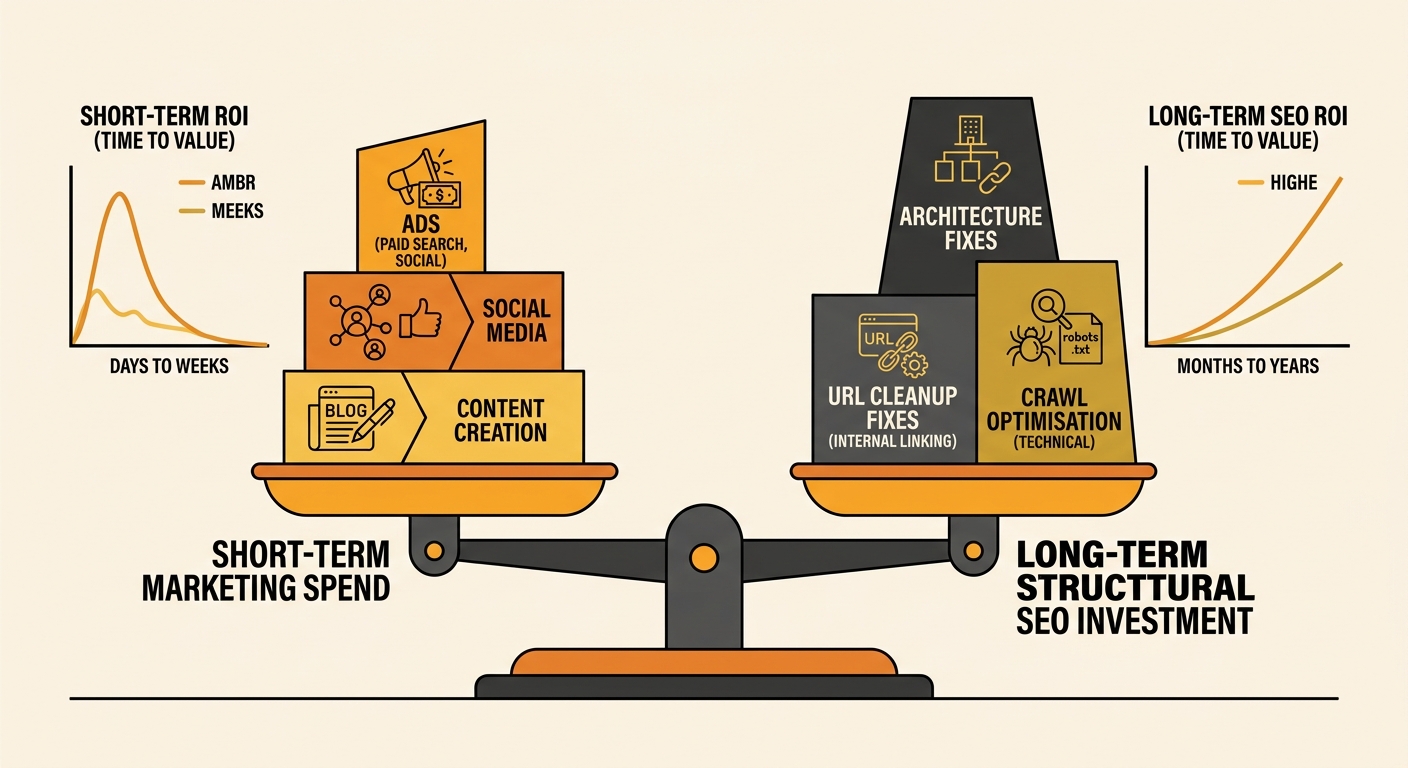
The tradeoff is real. Structural fixes compound over time because every new page you publish benefits from a cleaner architecture. But the ROI timeline doesn’t suit businesses that need leads this quarter. Architecture audits reveal genuine problems, and they reveal them accurately. Fixing everything the audit surfaces at once is rarely practical or financially sensible for a small business. The value lies in knowing the debt exists, measuring it, and paying it down deliberately across 6 to 12 months rather than ignoring it until a core update makes the cost impossible to avoid.