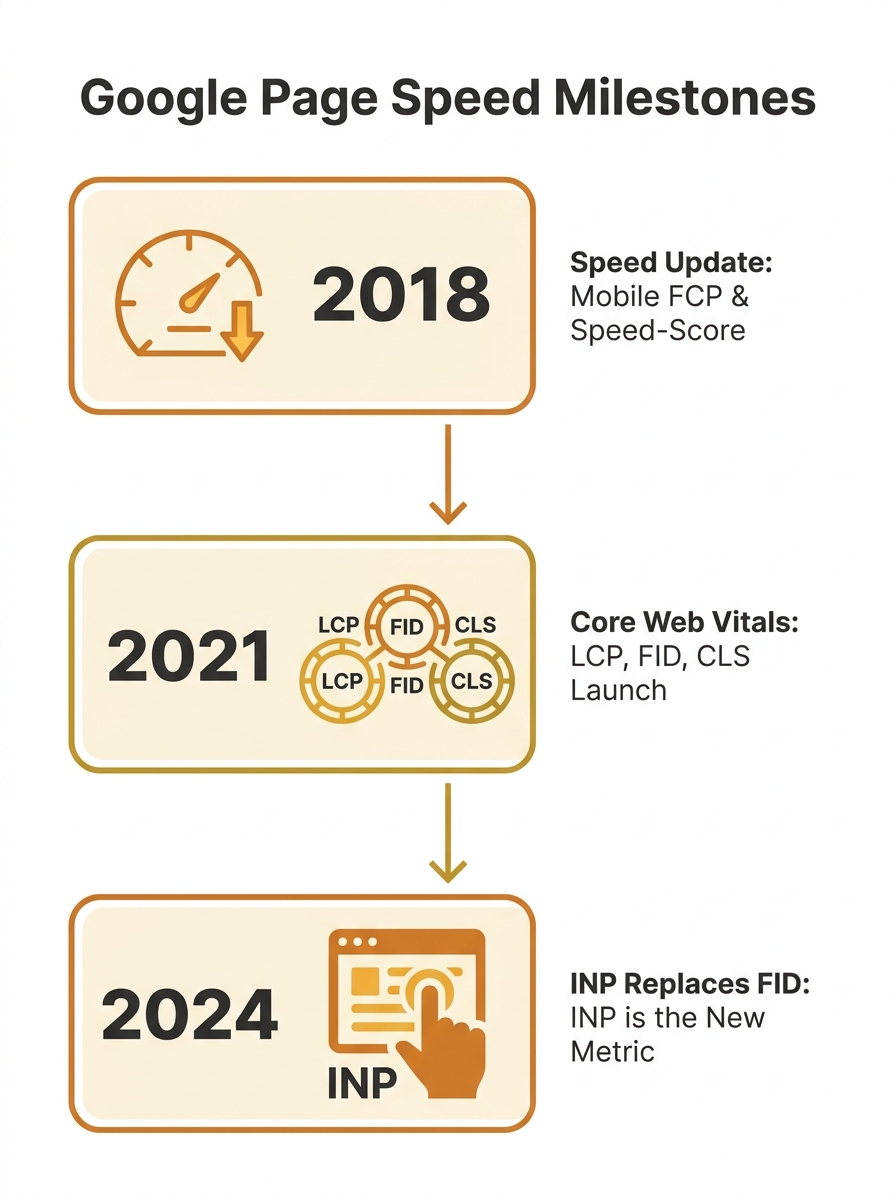
The Speed Update that Google rolled out in July 2018 turned mobile page load time into a confirmed ranking signal. The Australian SEO industry’s collective first instinct was predictable: compress every image on a site at once, ship it, and move on to the next client. This batch approach worked well enough when page speed was measured as a single number. But the metrics have since fractured into three distinct signals, and the order in which you tackle image compression now determines whether your optimisation work actually moves the needle on rankings. The sequence matters more than the tools you use to do it.
July 2018: Speed Becomes a Ranking Signal
Google’s announcement was clear but vague on implementation. Site speed was confirmed as a ranking factor, particularly on mobile, with slow-loading pages seeing bounce rates climb by up to 90%. But the guidance boiled down to “be faster,” and most agencies responded by running images through a bulk compressor and calling it done.
For a while, this was enough. Time to First Byte (TTFB) and Fully Loaded Page time were the primary indicators. Compress everything, reduce total page weight, and the single-number speed score improved. There was no reason to think about which images got compressed first, or how different compression strategies might affect different performance metrics independently.
Core Web Vitals Split the Problem Into Three
The shift happened when Google announced Core Web Vitals as ranking signals in 2021. Suddenly speed wasn’t one score. It was three: Largest Contentful Paint (LCP), which measures how long it takes the largest visible element to render; Cumulative Layout Shift (CLS), which tracks how much content jumps around during loading; and First Input Delay (FID), which measured responsiveness to the first user interaction.
Each metric responds to image optimisation differently. LCP cares almost exclusively about your hero image and above-the-fold content. CLS gets triggered by images that load without explicit width and height attributes. FID (and later INP) is affected by heavy image processing that blocks the browser’s main thread.
This meant the old approach of compressing every image equally was wasteful. An agency could spend hours optimising decorative footer images that contributed nothing to any of the three metrics, while leaving a 2.4MB uncompressed hero banner dragging LCP past the 2.5-second threshold for a “Good” score.
We’ve covered the broader problem of how under-optimised visuals damage technical SEO performance in detail before. The cascade concept builds on that foundation by adding sequence to the equation.
When LCP Forced a Priority Queue
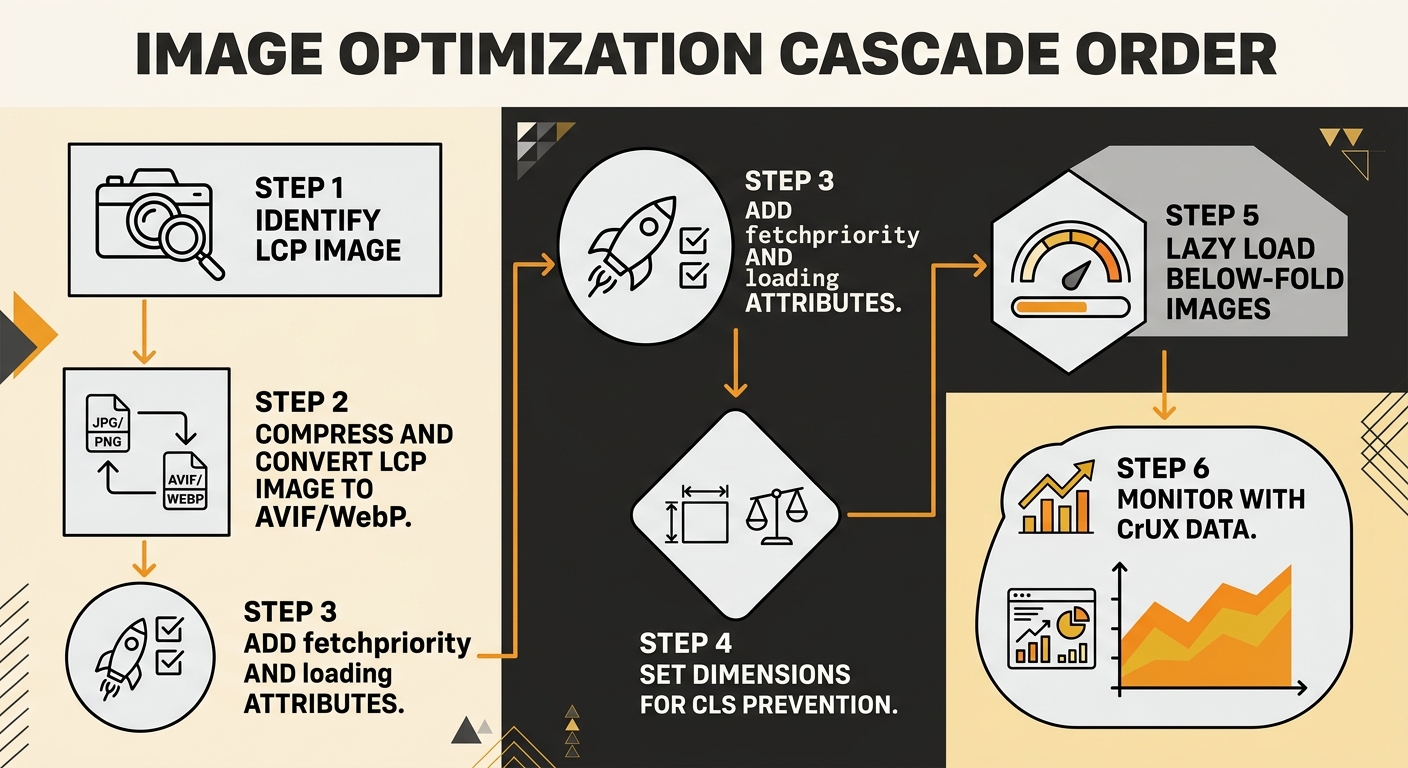
The critical realisation in image compression technical SEO circles was this: the hero image is almost always the LCP element on content-heavy pages, and it needs to load before the browser even thinks about below-the-fold content. Optimising file size, format, and delivery of the LCP image is one of the most effective ways to improve LCP scores.
This created a natural priority queue for Core Web Vitals optimization order:
- Identify the LCP element (usually the largest image in the initial viewport)
- Compress and convert that image first, using the most aggressive format available
- Add explicit loading priority signals to it
- Then work outward from the viewport, compressing secondary images
- Apply lazy loading to everything below the fold
The order matters because browser resource allocation isn’t unlimited. When you load fifteen images simultaneously without priority signals, the browser distributes bandwidth roughly evenly. Your hero banner competes with a thumbnail three screens down. The LCP timer keeps ticking while bandwidth gets split across requests that don’t affect any visible metric.
The order in which you compress and deliver images determines whether the work actually moves your Core Web Vitals scores, or just shrinks your total page weight without ranking benefit.
The Format Strategy Evolved in Stages
The image format strategy for web performance has gone through three distinct phases, and Australian sites have been slow to keep pace with each transition.
Phase 1: JPEG Compression (Pre-2020)
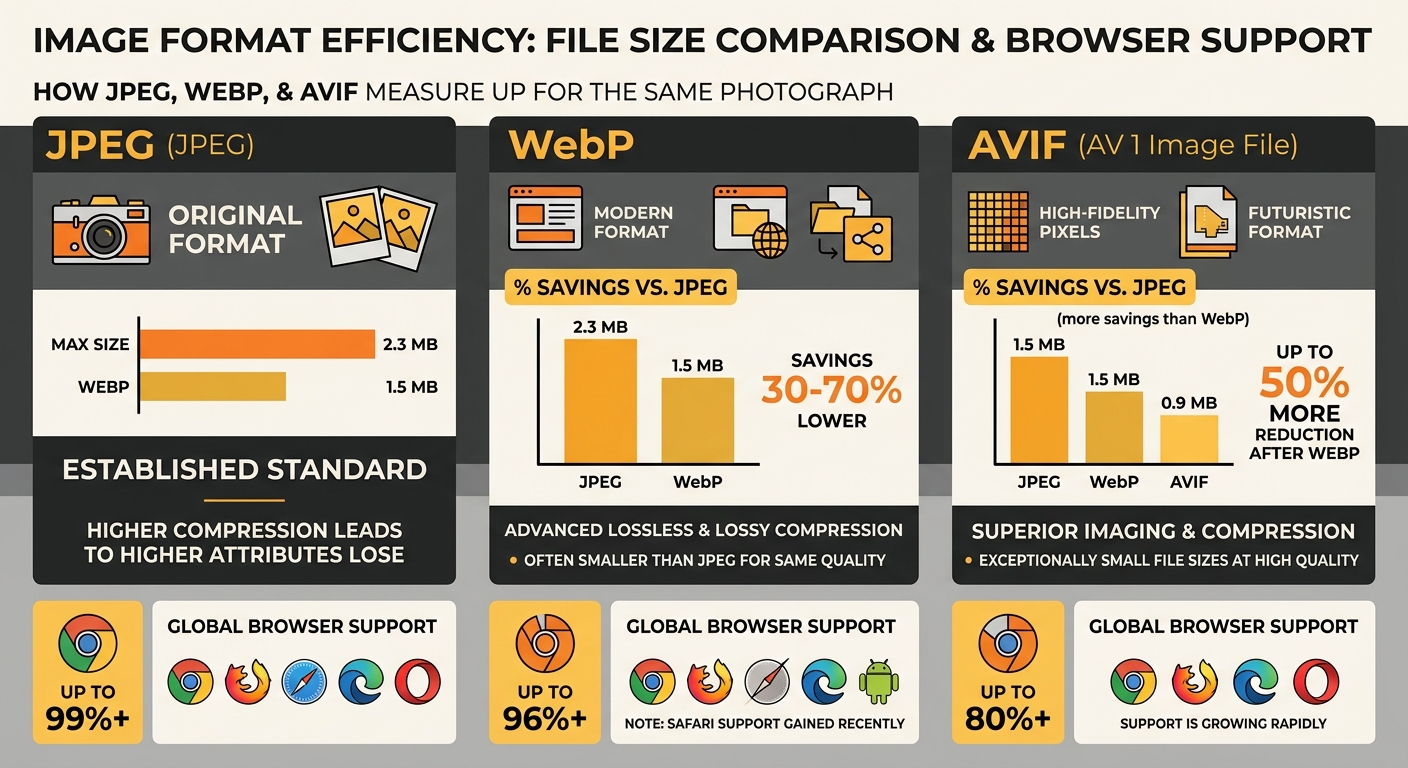
JPEG lossy compression was the default. You’d run images through a tool at 60-80% quality, shave off 40-60% of file size, and call it optimised. The format worked well for photographs and complex colour images, and browser support was universal.
Phase 2: WebP Adoption (2020-2023)
WebP delivered 25-35% smaller files than JPEG at equivalent visual quality. Browser support hit near-universal levels, and most CDNs and image services added automatic WebP conversion. If you’re only serving one modern format, WebP remains the safest choice due to roughly 99% global browser support.
Phase 3: AVIF Enters the Picture (2024-Present)
AVIF provides another 20-25% reduction on top of WebP for photographic content. Browser support now sits at 94.7% (Chrome 85+, Firefox 93+, Safari 16.4+), yet only about 0.7% of LCP images across the web actually use the format. The tradeoff is encoding time: AVIF encodes run 10-20x slower than WebP, which means you need to pre-generate these at build time or use a CDN with on-the-fly AVIF support.
The cascade principle applies here too. Your LCP image should get the most aggressive format treatment first. Serve AVIF to browsers that support it, fall back to WebP, and use JPEG as a last resort. Below-the-fold images can follow the same pattern, but they’re lower priority because they don’t affect the metrics Google actually uses for ranking.
The CLS Dimension Most Teams Miss
Here’s where compression order gets unintuitive. CLS has nothing to do with file size and everything to do with whether the browser knows how much space an image will occupy before it downloads. If your page loads on a 400-pixel-high viewport and 200 of those pixels shift when an image finally renders, that gives you an impact fraction of 50%. Combined with the distance fraction of the shift, you can blow past the 0.1 CLS threshold with a single badly-configured image.
This means your compression workflow needs a CLS pass that happens independently of file-size reduction:
- Add explicit width and height attributes to every image tag
- Use CSS aspect-ratio properties where responsive layouts make fixed dimensions impractical
- Confirm that lazy-loaded images have space reserved in the layout before they appear
Teams that compress images without setting dimensions often improve their LCP while worsening their CLS. The scores move in opposite directions, and the net ranking impact can be zero or negative. A proper page speed Australian rankings strategy accounts for all three metrics in the correct sequence.
If you’re tracking these changes over time, the rhythm of weekly versus monthly checks matters. CLS regressions often creep in gradually through content updates, and catching them early requires consistent monitoring rather than one-off audits.
FID Dies, INP Takes Over
In March 2024, Google replaced First Input Delay with Interaction to Next Paint (INP). Where FID only measured the delay on the first interaction, INP captures responsiveness across the entire user session. Clicking, typing, tapping, scrolling through image galleries: all of it counts.
Heavy images affect INP when their decoding blocks the browser’s main thread. A 4MB PNG being decoded while a user tries to tap a navigation menu creates measurable input delay. The fix sits in the same cascade: compress and convert your above-the-fold images first (reducing main-thread work during the critical early seconds), then lazy-load everything else so decode work happens only when images enter the viewport.
For sites going through a redesign or platform change, folding this compression cascade into the migration process prevents the common pattern of launching a visually polished new site that performs worse than what it replaced.
Where the Numbers Land Today
Google uses Chrome User Experience Report (CrUX) data for ranking decisions, drawn from real users rather than lab simulations. Your Lighthouse score is a diagnostic tool, not a ranking input. To pass the Core Web Vitals assessment, 75% of real user sessions need to hit “Good” thresholds across all three metrics: LCP under 2.5 seconds, CLS under 0.1, INP under 200 milliseconds.
Tip: Run PageSpeed Insights in CrUX mode, not just Lighthouse. The field data tab shows what Google actually uses for ranking. If your field data shows “Poor” LCP but your lab score looks fine, the compression cascade probably hasn’t reached your real users yet. Check that your CDN is actually serving the converted formats.
Over 55% of websites still fail mobile Core Web Vitals. For Australian businesses competing in local search results, that failure rate represents a genuine opportunity. Getting your image compression sequence right won’t turn a thin-content page into a top result, but among pages with comparable content and authority, the site with passing Core Web Vitals holds an edge.
If you’re an Australian business looking to connect these technical details with broader search performance, working with Melbourne SEO specialists who understand the interplay between image delivery and ranking signals makes a measurable difference to outcomes.
The cascade isn’t complicated once you see it as a priority queue rather than a batch job. Fix the LCP image first. Set dimensions for CLS second. Lazy-load the rest third. Then monitor with real-user data, because your optimisation only counts when actual visitors experience it. The sites that treat image compression as a sequenced workflow, rather than a checkbox on an audit spreadsheet, are the ones clearing the Core Web Vitals bar while their competitors keep wondering why their Lighthouse scores don’t translate into rankings.