
Google’s own support pages score 39 on PageSpeed Insights and rank on page one. Australian SMEs pour thousands into chasing that number when the real choice is between score-chasing, Core Web Vitals optimisation, and user-experience-first auditing. The right pick depends on where your site actually fails, not on what a synthetic lab test reports.
TL;DR: PageSpeed Insights lab scores don’t reliably predict Google rankings. Core Web Vitals function as a pass/fail threshold and tie-breaker, not a primary ranking signal. The highest-ROI approach for most Australian SMEs is a user-experience-first audit that combines real-user performance data with analytics and conversion metrics.
Option 1: Chasing the PageSpeed Insights Score
The default move for most Australian small businesses is to run their homepage through Google’s PageSpeed Insights, see a number under 60, and start fixing every item Lighthouse flags. The pattern is everywhere, and the results are consistently underwhelming.
An r/SEO thread examining top-ranking pages found that competitive first-page results, including Google’s own support documentation, scored as low as 39 on PSI’s performance metric. The highest-scoring page in that sample reached only 67. If pages scoring 39 to 67 occupy position one across multiple verticals, the number alone is clearly disconnected from ranking outcomes.
Part of the problem is measurement instability. Google’s own PSI documentation states that “local network availability, client hardware availability, and client resource contention” all introduce variability into Lighthouse results. Running the same URL twice can produce scores 15 to 20 points apart. Building a performance strategy around a number that fluctuates by a quarter of its range is building on sand.
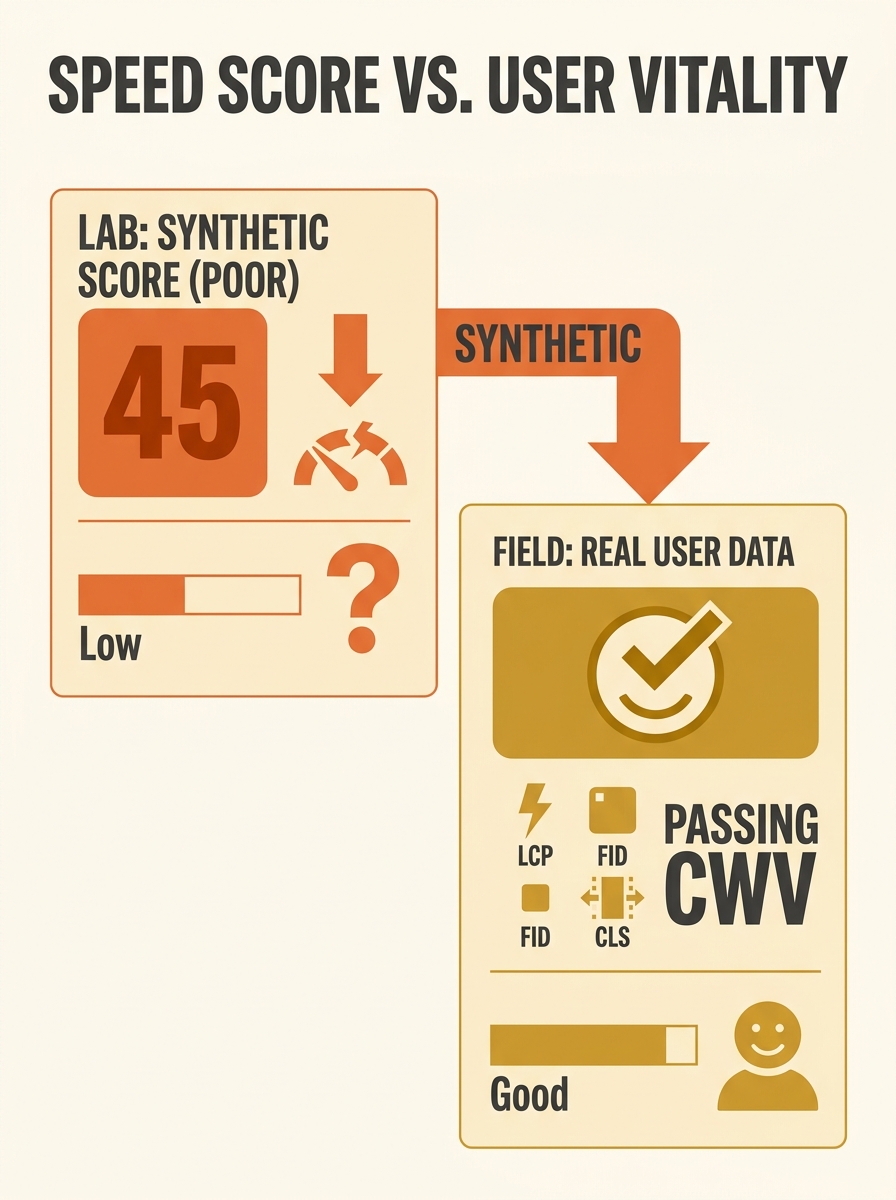
The PageSpeed Insights misuse pattern repeats across hundreds of Australian SME sites: a developer or agency spends 10+ hours removing render-blocking CSS, deferring every script, stripping chat widgets, compressing images that were already acceptably sized. The score climbs from 45 to 78. Rankings don’t move. Conversions stay flat. The invoice arrives anyway.
PSI’s lab score measures theoretical performance under synthetic conditions on a simulated mid-tier device. It doesn’t reflect how a real visitor on a Telstra 4G connection in suburban Brisbane experiences your page.
When Score-Chasing Makes Sense
There’s one scenario where this approach has value: your PSI score sits below 30 and your page takes more than 6 seconds to become interactive on mobile. At that severity, the underlying problems are bad enough that any optimisation work will improve both scores and real experience simultaneously. Below 30, you’re dealing with genuine failures, not measurement noise.
Option 2: Fixing Core Web Vitals Exclusively
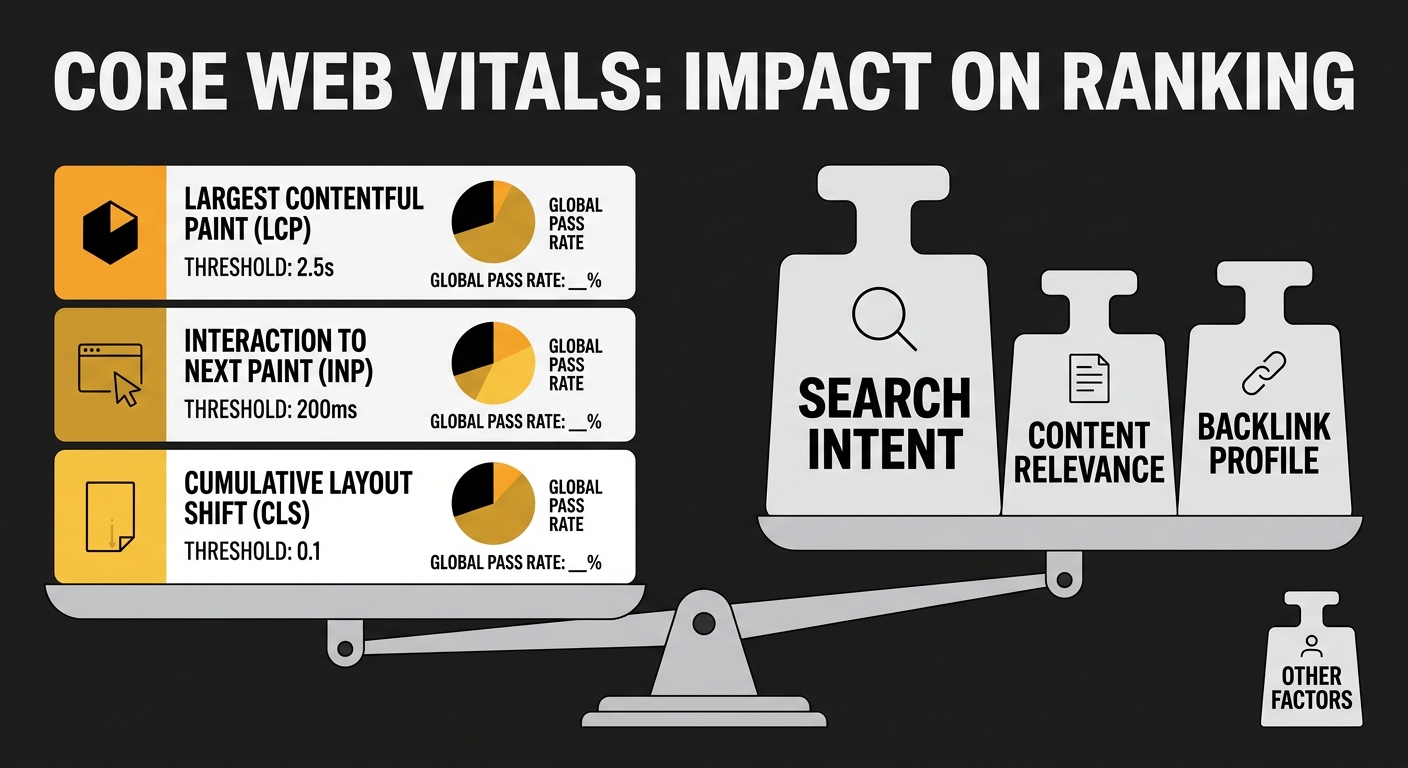
The second approach narrows focus to Google’s three Core Web Vitals: Largest Contentful Paint (LCP), Interaction to Next Paint (INP), and Cumulative Layout Shift (CLS). This is measurably better than score-chasing because these metrics draw from real-user data in the Chrome User Experience Report (CrUX), not lab simulations.
Core Web Vitals Australia data from the 2025 Web Almanac shows 81% of mobile pages globally now achieve a “good” CLS score, making layout shift the easiest of the three to pass. LCP and INP remain harder. Australian SME sites typically struggle with LCP because of unoptimised hero images (often 3 to 4MB on shared hosting) and slow Time to First Byte from budget servers.
White Label Coders’ 2026 analysis confirms these performance signals “directly influence how search engines evaluate page quality”. But the emphasis matters. A widely-referenced r/TechSEO discussion concluded that as a page speed ranking factor in 2026, Core Web Vitals “work more like a tie-breaker and a UX baseline” rather than a strong direct signal. Once all three metrics pass “good” status, additional optimisation yields zero additional ranking benefit. Shaving your LCP from 2.1 seconds to 1.4 seconds won’t move you up a single position if your content doesn’t match search intent.
Once all three Core Web Vitals pass “good” thresholds, additional speed optimisation yields zero additional ranking benefit.
Where This Approach Falls Short
The CWV-only approach misses performance problems that don’t map to Google’s three metrics. Time to First Byte (TTFB) isn’t a Core Web Vital but directly affects LCP and overall user experience. Font rendering issues affect Total Blocking Time and visual stability. Audit data from real-world site reviews shows 7 out of 20 sites fail font-display audits, and only 3 out of 20 pass audits for unused JavaScript reduction. These aren’t CWV failures per se, but they compound into real user frustration that drives bounces.
If you’re trying to trace the actual cause of a traffic drop, CWV data alone won’t tell you whether your slow pages lose visitors to poor font rendering, bloated third-party scripts, or content that simply doesn’t answer the query. Technical SEO metrics SME teams track need to extend beyond these three numbers.
Option 3: User-Experience-First Performance Audit
The third approach treats speed as one dimension of user experience rather than an isolated checklist item. The audit starts with what users actually encounter: how quickly visible content appears, whether they can interact without lag, and whether the page shifts around while loading.
This sounds similar to CWV, but the methodology differs. A UX-first audit measures real session behaviour alongside technical metrics: bounce rates on specific pages, scroll depth, time-to-first-interaction from analytics, conversion rates before and after performance changes. Australian agencies reporting a 111% surge in organic traffic for hospitality clients achieved it through targeted local keywords, technical fixes, and schema markup working together. Service-based businesses in the same study achieved 2x conversion rates by prioritising high-intent queries alongside Google Business Profile enhancements, with speed as one piece of the picture rather than the whole frame.
The UX-first approach also prevents a destructive pattern we see regularly: businesses removing FAQ sections, testimonial blocks, or social proof widgets to shave 0.8 seconds off load time, then watching rankings drop because those content elements were satisfying search intent. If your page answered a query well but loaded in 3.8 seconds, removing the answer to hit 2.2 seconds makes the score better and the page worse.
Warning: Removing content blocks (FAQs, reviews, social proof) to improve speed scores can hurt SEO indexing and conversion rates simultaneously. Always verify whether a content element serves search intent before stripping it for performance gains.
The practical difference shows up in how you handle third-party scripts. A score-chasing approach removes the live chat widget entirely. A CWV approach defers it. A UX-first approach asks: does this chat widget generate $4,200 per month in qualified leads? If so, keep it, defer the script load to after the page becomes interactive, and accept the 3-point PSI score reduction as a trade worth making.
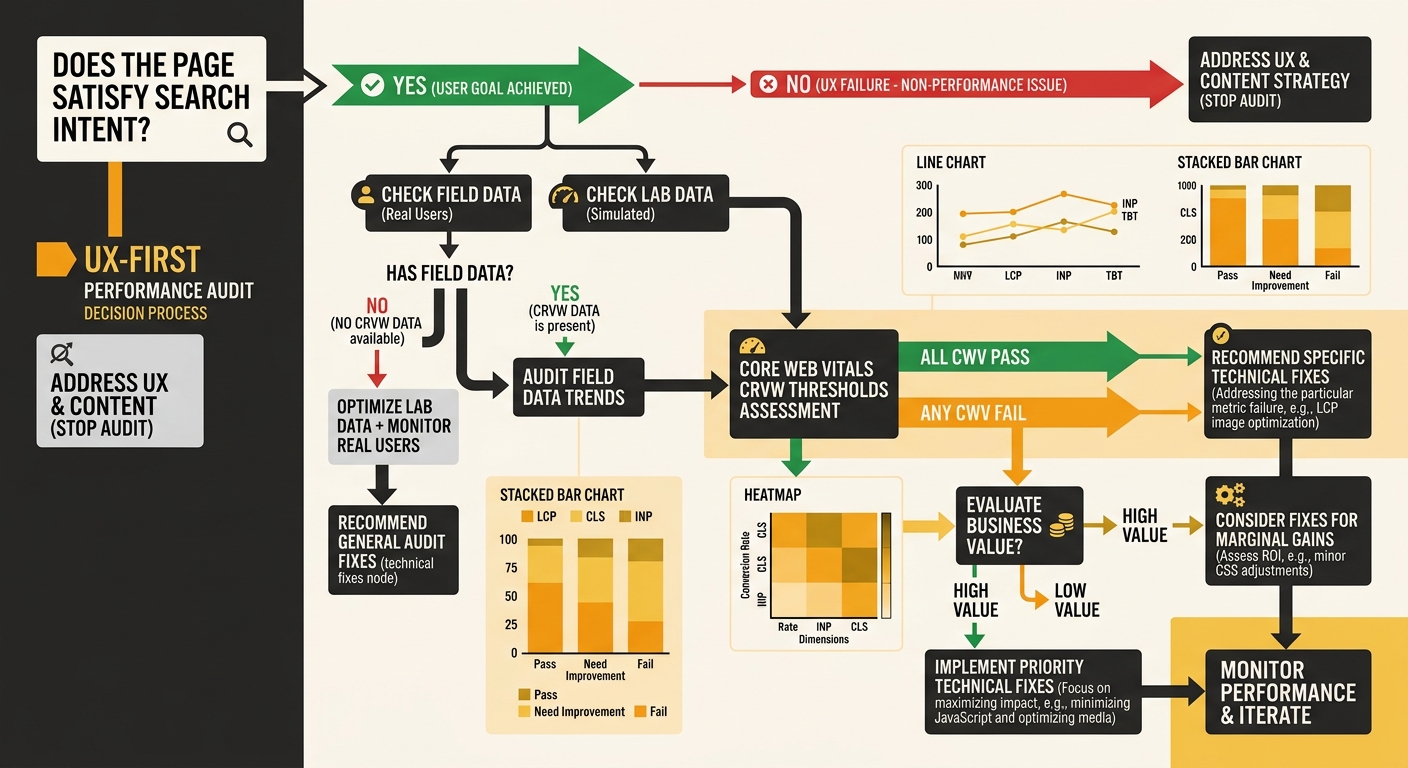
A Decision Framework for Each Fix
Evaluate each flagged performance issue against three criteria: does it affect real users in CrUX field data (not Lighthouse lab data)? Does it push a Core Web Vital from “good” to “needs improvement” or worse? And does fixing it preserve the content’s ability to convert? Issues that fail all three tests sit at the bottom of the priority queue, regardless of how many orange triangles PageSpeed Insights displays.
Comparison at a Glance
| Factor | Score-Chasing (PSI) | CWV-Only | UX-First Audit |
|---|---|---|---|
| Data source | Lighthouse lab simulation | CrUX real-user data | CrUX + analytics + conversion data |
| Ranking impact | Minimal once past basic threshold | Moderate (tie-breaker level) | Highest (compounds with content quality) |
| Typical SME cost | $500–$2,000 in dev hours | $1,000–$3,000 for targeted fixes | $2,000–$5,000 including analytics review |
| Risk of harm | Medium (may remove valuable content) | Low | Very low |
| Time to measurable outcome | 1–2 weeks for score change | 28 days for CrUX data refresh | 4–8 weeks for ranking and conversion data |
| Best for | Sites scoring below 30 with severe issues | Sites failing CWV thresholds in CrUX | Sites passing CWV but underperforming commercially |
How to Choose Between These Three
The right approach depends entirely on where your site sits today.
If your PageSpeed Insights score is under 30, your pages take more than 6 seconds to load, and you’re running 4MB uncompressed hero images on shared hosting, start with the basics. Score-chasing, in that scenario, overlaps heavily with genuine performance improvement because the site has real structural problems that any method would surface.
If your site loads reasonably but CrUX data shows you’re failing one or more Core Web Vitals thresholds, the CWV-focused approach gives you the clearest return. Fix LCP by optimising your largest above-the-fold image and upgrading to a server with sub-800ms TTFB. Fix CLS by setting explicit width and height attributes on images and embeds. Fix INP by breaking up long JavaScript tasks into smaller chunks. These are well-documented fixes with predictable outcomes, and passing those thresholds removes a genuine (if modest) ranking drag.
If your CWV data already shows “good” across all three metrics and you’re still not ranking where you expect, performance isn’t your bottleneck. An SEO strategy review examining content depth, intent alignment, and link profile will almost always surface the actual blocker. Businesses that went through content rebuilds after core algorithm updates recovered 60% of lost traffic by addressing content gaps, not by trimming milliseconds.
And if you’re already ranking but watching positions slide, the answer is almost certainly content or intent mismatch rather than speed. The page speed conversation in Australian SME circles has been dominated by a single tool and a single number for too long. Good search engine optimisation services address the metrics that move rankings and revenue. In 2026, those metrics are content relevance, user engagement, and CWV thresholds treated as a pass/fail gate. Everything beyond that gate is maintenance work, and it should be priced and prioritised accordingly.