
Australian SMEs tracking keyword rankings weekly without connecting that movement to conversion and revenue data are measuring activity, not growth. The SEO benchmarks Australia’s growing small businesses watch combine ranking velocity, organic session quality, and revenue-per-visitor trends into a weekly signal that predicts where revenue is heading 60 to 90 days out.
The Case for Weekly Cadence
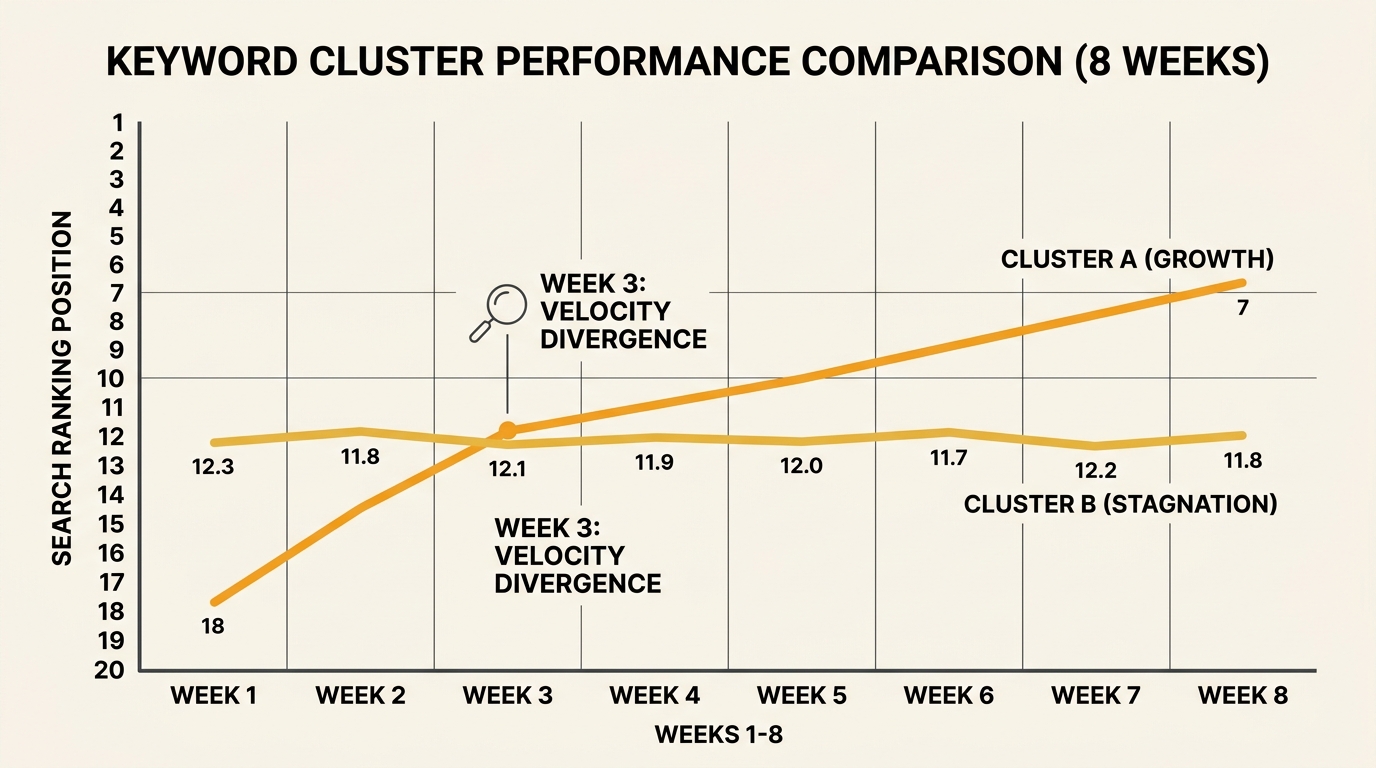
Monthly reporting buries the leading indicators inside averages. A keyword cluster that gains 4 positions across 15 terms in week two but loses 3 positions in week four looks flat in a monthly summary. That directional movement is where growth signals live, and weekly keyword ranking tracking catches these shifts before they compound, giving you a window to double down on what’s working or fix what’s broken while the correction cost is still small.
An SMBtech review of SEO services for Australian small businesses made the point bluntly: “I wanted business key performance indicators, or KPIs, such as qualified leads, booked work, and revenue proxies, not just rank trackers.” That distinction matters because ranking data in isolation tells you where Google placed a page, not whether that placement is producing anything useful. The weekly cadence forces you to pair ranking shifts with the business outcomes they’re supposed to drive, which reshapes how you read every data point.
SEO Services Australia’s monitoring framework supports this principle. As their guide puts it, “If you’re publishing new content twice a week and running an active link-building campaign, weekly monitoring is essential because you need fast feedback on what’s working.” For SMEs running fewer updates, a fortnightly check with a deeper monthly review may be sufficient. But the core principle holds: the faster your publishing cadence, the tighter your measurement loop needs to be. The organic traffic metrics SME owners often ignore (session quality, engagement depth, conversion path data) only reveal their patterns at weekly resolution.
Ranking Velocity as a Leading Indicator
The single most underrated metric for SME growth prediction is ranking velocity: the rate and direction of keyword position changes across a defined cluster, measured weekly. A page sitting at position 14 that has moved from position 28 over three weeks carries more growth potential than a page sitting stable at position 6. Tools like Semrush’s Position Tracking and Ubersuggest’s rank tracking feature both allow daily and weekly monitoring of mobile and desktop positions, SERP feature appearances, and competitive gaps against rival domains.
What makes velocity predictive is the lag between ranking improvement and traffic realisation. Australian industry CTR data shows substantial variation by sector: legal services average 6.6% CTR, while healthcare sits at 3.3%. An SME in legal moving from position 8 to position 4 on a term with 2,400 monthly searches stands to gain roughly 158 additional clicks per month from the CTR shift alone, and that’s before factoring in the compounding effect across related terms in the same topical cluster. If you’ve structured your site hierarchy around topical clusters, these gains tend to cascade across supporting pages within 2 to 4 weeks of the primary page’s movement.
The SEO performance KPIs small business owners typically obsess over, like “we rank #1 for our brand name,” are the wrong ones. Branded rankings rarely move and rarely predict revenue growth. The terms that matter are commercial-intent, non-branded queries where position changes between 3 and 15 directly affect whether anyone finds you at all. Weekly tracking of these clusters, sorted by velocity rather than absolute position, reveals which content investments are paying off within 2 to 3 weeks instead of the typical 3-month lag in monthly reporting. Brand Express Company’s research supports this approach: a single service page optimised for a targeted commercial keyword generated 70% more qualified leads than its generic predecessor, precisely the kind of result that velocity tracking would surface early.
From Organic Sessions to Revenue Signal
Ranking movement becomes commercially meaningful when connected to what happens after the click. Neil Patel’s analysis of organic traffic revenue data found that revenue per visitor increased by roughly 27% between 2024 and 2025, rising from $4.20 to approximately $5.33. That shift reflects improving conversion paths and content quality, not traffic volume alone. An SME adding 500 organic sessions per month at the higher revenue-per-visitor rate gains around $565 in incremental monthly revenue from that traffic, a figure that compounds across keyword clusters as velocity improvements cascade through the site.
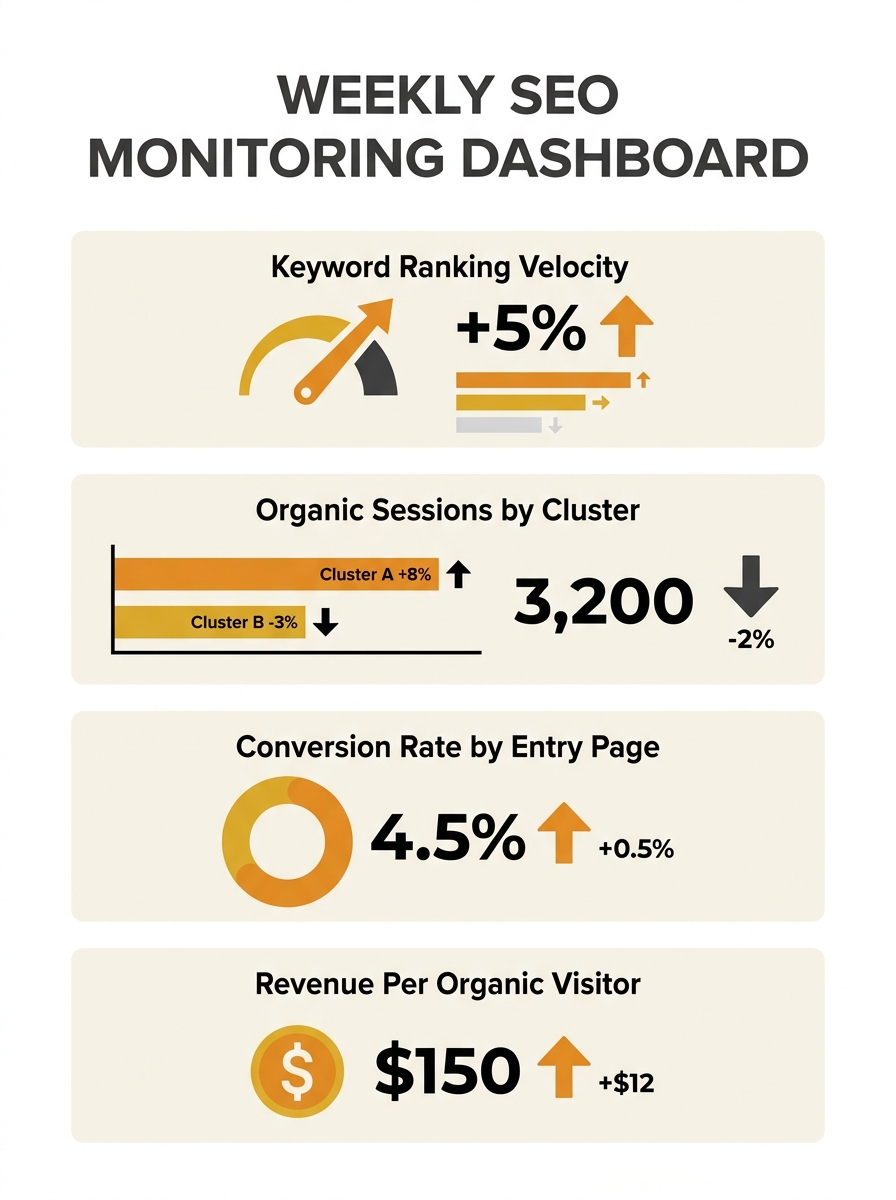
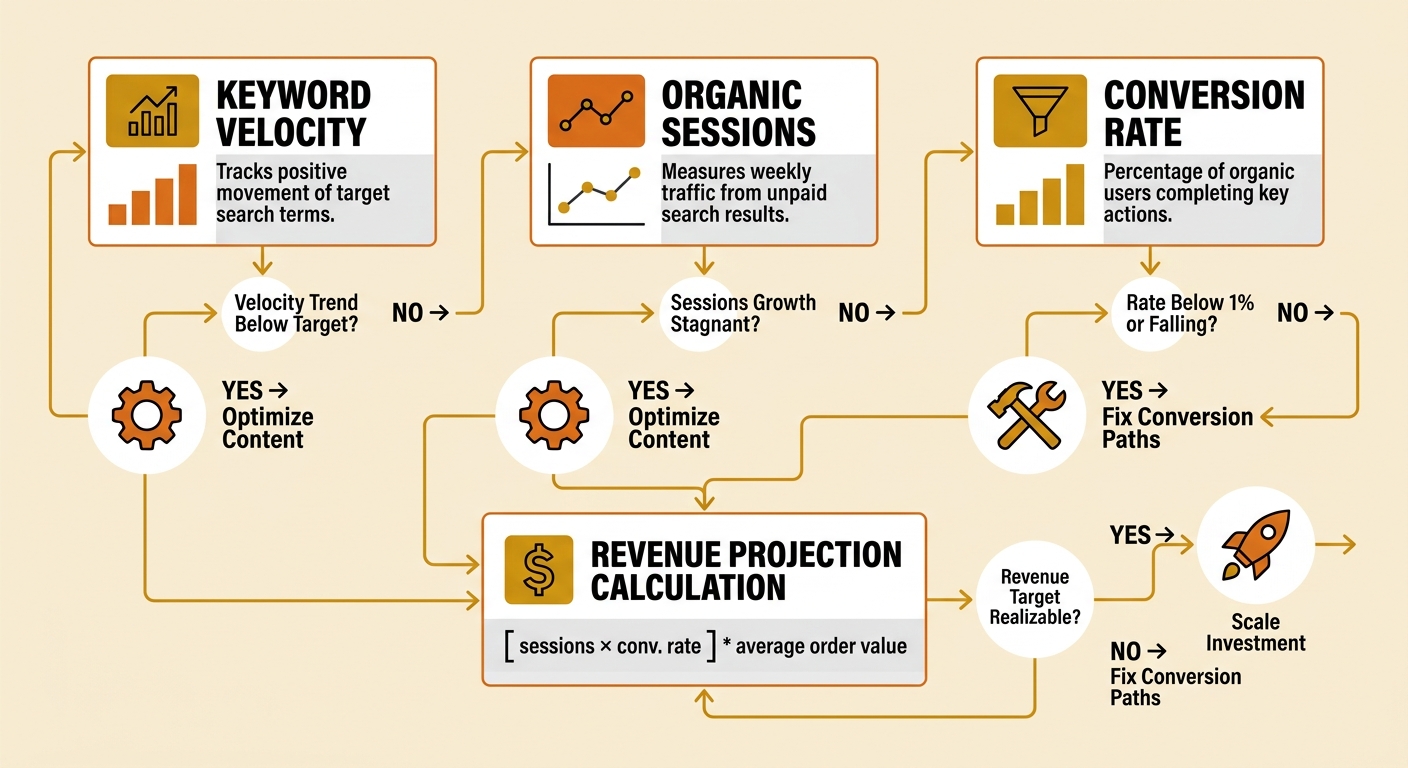
The weekly numbers worth watching include three figures: organic sessions by landing page cluster, conversion rate by entry point, and estimated revenue per organic visit. E-commerce conversion rates nationally average 2.5% to 3%, while B2B lead generation averages 2% to 5%. If your conversion rate sits below your sector average and your traffic is growing, you have a content-to-conversion gap. No amount of ranking improvement will fix it. This is where the debugging workflow for diagnosing traffic issues becomes essential, because the problem often sits in page experience rather than SERP position.
Hashmeta’s modern SEO performance guide explained the forecasting logic clearly: “If your conversion rate, CLV, and organic traffic are all trending positively, you can project future revenue with reasonable confidence.” That triple trend, all three metrics moving in the same direction, is the growth signal. When one diverges (traffic up, conversions flat), you’ve found the bottleneck. Nearly 50% of Australian Google searches carry local intent according to SEO Masterclass’s 2026 guide, which means SMEs running local service businesses should weight their weekly metrics toward Google Business Profile performance and local pack visibility. Sterling Sky’s research found 76% of mobile local searches convert to visits within 24 hours, a conversion speed that makes weekly GBP monitoring a revenue-level activity for trades and professional services. Pairing this with a structured local SEO audit framework gives you a clear picture of whether local visibility improvements are translating to actual bookings.
The growth signal is three metrics trending in the same direction: conversion rate, customer lifetime value, and organic traffic. When one diverges, you’ve found the bottleneck.
Where Measurement Becomes Guesswork
Everything above rests on an assumption worth interrogating: that the relationship between ranking velocity, traffic, and revenue remains stable enough to predict from. For many Australian SMEs, it does hold over 60- to 90-day windows. But several forces are making that prediction harder. AI-generated search results are siphoning clicks from traditional organic positions, meaning a page can maintain its ranking while losing traffic. Google’s core and spam updates are reshuffling rankings with increasing frequency; the June 2026 spam update caught businesses that hadn’t adjusted their content practices, resetting months of velocity gains overnight.
The rise of AI search surfaces also means organic traffic metrics for SME websites may increasingly undercount total brand visibility. A business cited in ChatGPT or Perplexity answers receives exposure that never appears in Google Analytics sessions. Weekly benchmarking captures the traditional search channel well, but it doesn’t yet account for this growing slice of discovery. The honest position is that weekly SEO benchmarking gives you the best available signal, not a guarantee of precision. You’re tracking leading indicators in a system where the platform owner changes the rules on its own schedule. The SME that treats these metrics as directional intelligence, adjusting investment toward the clusters showing velocity and conversion alignment, will outperform the one waiting for monthly reports to reveal trends that have already passed. But the gap between what we can measure and what actually drives growth is widening, and any benchmarking framework that ignores that tension is selling false confidence.